Capacity planning with real numbers, not vibes
Every budget season, managers walk into planning meetings armed with anecdotes: the team is drowning, everyone is stretched, we need three more people. Sometimes they are right. But the requests that survive scrutiny are the ones backed by utilisation data rather than a feeling of busyness.
“Busy is a feeling. Utilisation is a number. Only one of them survives a finance review.”
The annual guessing ritual
The traditional capacity conversation goes like this. A manager says the team is at breaking point. Finance asks for evidence. The manager points to a full calendar and a backlog. Finance approves half the ask, everyone feels vaguely cheated, and nobody learns whether the original number was right.
We watched this play out at a 220-person logistics firm in Rotterdam before they started measuring anything. Their operations lead had requested six new coordinators two years running. When we finally plotted actual active hours against contracted hours, the team was averaging 71% utilisation with wild variance between individuals. The problem was not headcount. It was distribution.
That single chart killed a €400,000 hiring plan and replaced it with a rebalancing exercise that took three weeks.
What utilisation actually means
Utilisation is not hours at a keyboard. We define it as focused, classified work time as a share of expected working time, aggregated at team level over a rolling four-week window. One noisy week tells you nothing. A month of pattern tells you a great deal.
The distinction matters because raw activity flatters everyone. A coordinator who spends six hours in email triage looks identical to one who spends six hours resolving shipments, until you classify the applications and weight the deep-work blocks. Momentum’s focus scoring separates the two, and the gap between them is usually where your capacity is hiding.
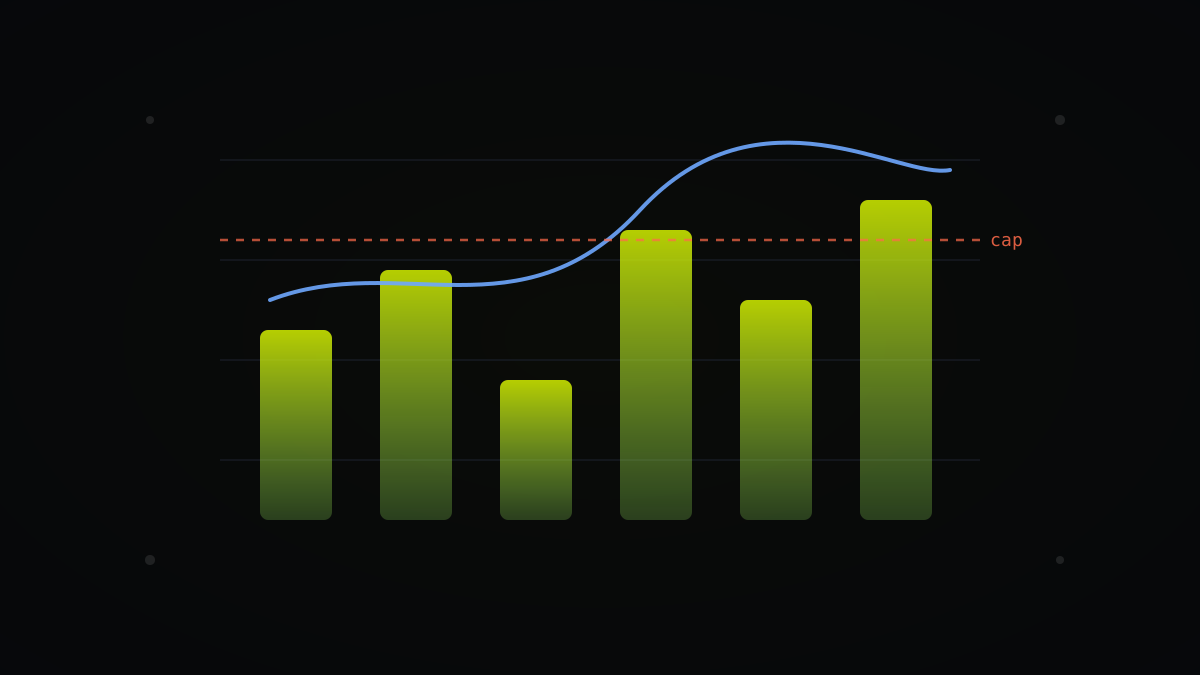
A healthy knowledge team tends to sit between 65% and 80% on this measure, with the remainder absorbed by legitimate slack: learning, recovery, the unplanned conversations that make organisations work. Above 85% for more than a few weeks, you do not have a productivity triumph. You have a burnout risk wearing a nice dashboard.
The Pune support org that hired nobody
A 40-person support organisation in Pune came to us convinced they needed ten more agents to hit their response-time targets. Ticket volume had grown 30% in a year, first-response times had slipped from 40 minutes to over an hour, and the team lead had the escalation emails to prove it. The maths seemed obvious, and the budget request was already drafted.
The heatmap said otherwise. Their utilisation peaked at 92% between 10am and 1pm, then collapsed to 48% after 4pm, because shift patterns had been copied from a legacy voice-support rota that no longer matched when tickets arrived. Demand had shifted; supply had not.
They restaggered shifts, moved four agents to a late window, and offered a small allowance for the less popular hours, which eleven people volunteered for. Response times improved 22% within six weeks and the escalation emails stopped. Headcount added: zero. The finance team sent us a very nice email, which we have kept.
Finding the hidden 15%
In almost every organisation we analyse, somewhere between 10% and 18% of paid capacity is consumed by work nobody would defend if they saw it itemised. Status meetings that exist because they always have. Manual report assembly that a template would kill. Tool-switching taxes that add up to forty minutes a day.
You cannot recover this by exhortation. You recover it by naming it. When one engineering director showed her team that internal reporting consumed 11% of their aggregate week, the team cut it themselves within a sprint. Nobody defends waste once it has a number attached.
This is why we insist on aggregate-first views for capacity work. The point is not to catch an individual slacking; individual variance is mostly noise at planning scale anyway. The point is to find the structural leak that no single person can see from inside it, because everyone assumes their own wasted hour is the exception.
When the data says hire
Sometimes the numbers vindicate the manager. A fintech customer in Warsaw ran their compliance team at 88% sustained utilisation for a full quarter, with deep-work blocks shrinking week on week as interrupt-driven requests grew. That is not a rebalancing problem. That is a team quietly running out of road.
The difference is that their hiring request went to the board with a trend line, a utilisation threshold, and a projected date when the team would breach it. It was approved in one meeting. Compare that with the usual three rounds of negotiation, and the data pays for itself in calendar time alone.
Evidence does not always say no. It says no to the wrong asks so the right ones move faster.
Respect the seasons
A single month of utilisation data will lie to you. Retail operations teams look overstaffed in February and desperate in November. Accounting firms invert the pattern. If you set your baseline during a trough, every peak looks like a crisis demanding permanent headcount.
We encourage customers to hold at least two quarters of history before making structural decisions, and ideally a full year. Momentum’s analytics let you overlay the same weeks year on year, which is where the honest picture lives. One media company discovered their supposed growth in workload was almost entirely an annual cycle they had simply never charted.
Permanent hires for seasonal peaks are the most expensive mistake in this discipline, because the cost repeats every year the trough returns. Contractors, cross-training and shift flexing are almost always cheaper answers to a curve that comes back down, and the utilisation history tells you precisely how high the peak really gets and how long it lasts.
Start with one team and one question
You do not need an organisation-wide programme to begin. Pick the team with the loudest capacity complaint, run four weeks of aggregate measurement, and ask one question: where does the time actually go? The answer is nearly always surprising, and surprise is what changes budget conversations.
In practice, the pattern holds with unusual consistency. Teams that plan capacity from measured utilisation grow headcount more slowly than instinct-driven peers while hitting the same output targets, and their managers spend far less of the year arguing about staffing. That difference compounds quietly, budget cycle after budget cycle.
The vibes are not always wrong. But you only find out which vibes were right by checking them against a number.
faster response times after restaggering shifts, with zero added headcount
If you only remember four things
- Define utilisation as focused, classified work time over a rolling four-week window, not raw activity at a keyboard.
- Check shift patterns against demand curves before hiring; the Pune support org fixed a 30% volume increase with zero new heads.
- Sustained utilisation above 85% is a burnout risk signal, not a productivity achievement.
- Hold at least two quarters of data before structural decisions, or seasonal troughs and peaks will distort every baseline.
Writes for The Signal about operations and the future of measurable, humane work — drawing on anonymised patterns from the teams and focus hours analysed on Momentum.
Want this picture for your teams?
See timelines, productivity scores, and department comparisons on your own data.
Book a demo