The hardware nobody's watching: what an unmanaged fleet costs
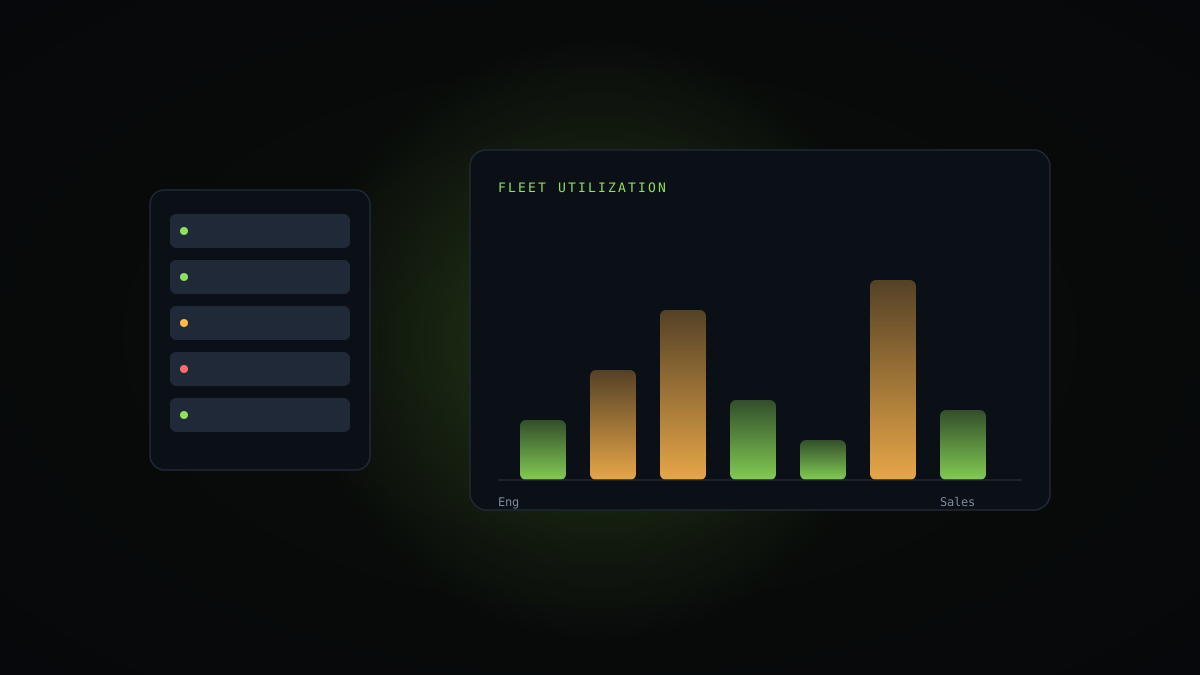
Hardware budgets get spent on whoever complains loudest, which is a terrible allocation mechanism for a resource that's actually measurable. This is about what happened when a 300-machine fleet finally got a CPU and memory number attached to every device in it.
“We refreshed forty laptops for the team that complained. The team that was actually capacity-starved was quiet — because they'd stopped expecting anyone to notice.”
The refresh that fixed nothing
A software consultancy we work with spent just over $200,000 refreshing laptops two years ago, prioritised almost entirely by who had filed the most support tickets. The engineering team, whose local builds were genuinely CPU-starved, filed almost none — they'd learned years earlier that complaining didn't move the queue, so they just worked around it, badly, with longer build times and more coffee breaks.
Six months after the refresh, a resource-usage audit found the real bottleneck untouched: a cohort of build machines running sustained CPU above 85% for hours at a stretch, on hardware two generations behind what the workload needed. The squeaky wheels had gotten new laptops they barely needed. The quiet team kept working on the machines that were actually failing them.
Squeaky-wheel budgeting is the default, not the exception
This isn't a story about one bad decision. It's the default outcome when hardware spend has no data behind it. Complaints correlate with who's comfortable escalating, not with who's actually under-resourced — and the people quietly absorbing a slow machine into their daily routine are disproportionately the ones least likely to make noise about it.
Once you have per-machine CPU and memory data over time, the allocation question stops being a personality contest. It becomes: which devices are sustained above 80% utilisation for meaningful stretches of the week, and which are sitting at 15% doing email and Slack. Both answers are useful, and neither shows up in a ticket queue.
What starvation actually looks like in the data
It's rarely a dramatic spike. The pattern that predicts a genuine capacity problem is duration, not peak: a machine sustained above 80% CPU for three or more hours a day, most days, for weeks. A single afternoon of heavy compilation doesn't need a hardware upgrade. A department where that's the daily baseline does.
In the fleets we've measured, this pattern typically concentrates in ten to fifteen percent of machines — almost always engineering, data, or design workstations running local builds, renders, or large files. Fixing that tier first is usually the highest-return hardware spend a company makes all year, and it's invisible without the data.
The other half nobody budgets for: idle capacity
Right-sizing runs in both directions, and the underused half of the fleet is where a surprising amount of budget hides. Machines sitting at 10-20% utilisation running little beyond email, a browser, and a chat client are commonly two or three hardware generations newer than the workload requires — often because refresh cycles are age-based rather than usage-based, and a role change left someone with hardware built for a job they no longer do.
One customer redirected eleven high-spec machines from an idle sales cohort to an under-provisioned data team during a refresh cycle, at zero net hardware spend. Nobody complained; nobody had noticed the mismatch existed until the data made it visible in one sorted list.
What doesn't work
Age-based refresh cycles — replace everything every three years regardless of actual load — spend evenly across a fleet that isn't loaded evenly, which means the starved tier waits as long as the idle one. Anonymous surveys asking people to rate their machine's performance produce noisy, self-serving data; nobody calibrates 'slow' against anyone else's baseline.
And a spec sheet alone tells you what a machine can do, never what it's actually being asked to do. Two identically specced laptops, one on a build server workload and one on email, are not the same purchasing decision — but they look identical on paper.
Where to start Monday
Pull fleet-wide CPU and memory utilisation for the last thirty days and sort two ways: highest sustained load, and lowest. The top decile is your real hardware queue, regardless of who's been asking loudest. The bottom decile is your redeployment pool before it's your next purchase order.
Do this before the next refresh cycle gets budgeted on vibes. The data already exists on every managed machine — it just needs to be looked at in one place instead of trusted to whoever remembers to complain.
If you only remember four things
- The median knowledge worker switches application context every one minute and 52 seconds, far more often than managers estimate.
- Chat drives only about a third of switches; self-directed habits and multi-system workflows account for the rest.
- Protected 90-minute blocks with rotating interrupt coverage cut complex-ticket handle time 18 per cent in a 40-person support org without hurting customer satisfaction.
- Fix the largest structural source of switching before running any behavioural campaign, then re-measure after three weeks.
Writes for The Signal about operations and the future of measurable, humane work — drawing on anonymised patterns from the teams and focus hours analysed on Momentum.
Want this picture for your teams?
See timelines, productivity scores, and department comparisons on your own data.
Book a demo